|
 |
 |
 |
 |
 |
 |
 |
 |
 |
 |
 |
 |
 |
 |
 |
 |
 |
 |
 |
 Previous Page

12.pdf
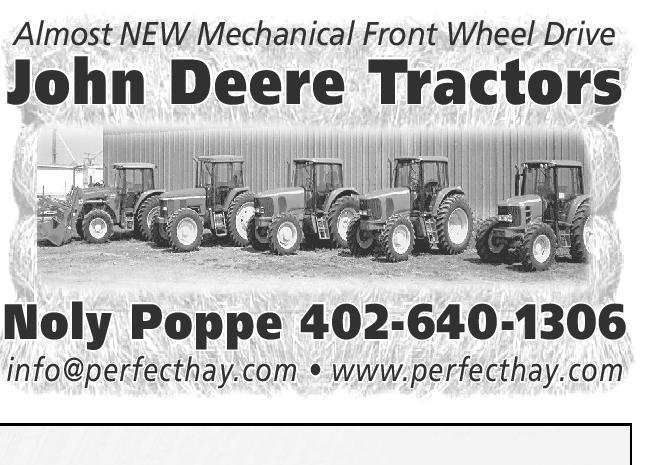
Poppe Hay Company


Shop online at www.missourivalleyshopper.com
March 12, 2013 • Page 12
? INDEXES
From Page 11
"The model considers
how changes in those
traits might affect percent
calf crop and weaning
weights, and also considers what might happen to
feed costs over time using
real world prices for both
cattle and feed."
When using selection
indexes, Rusche says cattle
producers still need to use
their common sense.
"We could have a case
where a bull might be
undesirable for one trait,
but so superior for one or
two that he still ranks very
high on an index," he
said. "A rancher might
want to set some minimum or maximum values
for some traits to make
sure that the bull will "fit"
in their system."
Also, Rusche explains
that these indexes are set
up using a one-size fits all
approach that may not
exactly work in every cattle producer's situation.
Breed
Angus
Selection Index
Cow Energy Value
Weaned Calf Value
Feedlot Value
Grid Value
Quality Grade
Yield Grade
Beef Value
Abbreviation
$EN
$W
$F
$G
$QG
$YG
$B
Charolais
Terminal Sire Profitability Index
Gelbvieh
Feedlot Merit
Carcass Value
FM
CV
Hereford
Badly Maternal Index
Calving EZ Index
Brahman Influence Index
Certified Hereford Beef Index
BMI$
CEZ$
BII$
CHB$
Limousin
Mainstream Terminal Index
$MTI
Simmental
All-Purpose Index
Terminal Index
API
TI
If you don’t get the word out
about your business,
no one else will!!!
Changes to the Cattle
Feeding Industry
The February Cattle on
Feed report released by
the USDA Feb. 22 shows a
continuation of the trend
towards fewer, but larger,
feedyards, says Darrell R.
Mark, Adjunct Professor
of Economics at South
Dakota State University.
"In fact, there were
2,000 or 2.7 percent
fewer feedyards with less
than 1,000 head capacities on January 1, 2013
compared to a year ago,"
Mark said.
Mark says the report
showed there were 30
fewer feedyards with
1,000-1,999 head capacities at the beginning of
this year and there was an
increase of 10 feedyards
over the last year with
capacities ranging from
2,000 to 3,999 head. The
number of feedyards with
4,000 to 15,999 head
capacities remained constant over the last year, at
515. The number of feedyards with 16,000-23,999
head capacities and
24,000- 31,999 head
capacities increased by 2
and 3, respectively, which
are 2.3 percent and 5.8
percent increases. The
number of 32,000-49,000
head capacity feedyards
declined by 5 while the
number of 50,000-plus
head capacity feedyards
stayed constant at 66.
In 2012, the feedyards
with less than 1,000 head
capacities marketed 2.854
million head.
"That's only 11 percent
of total fed cattle marketings for the year, despite
the large number of these
small feedyards - totaling
73,000," he said.
Further, Mark says this is
a decline from 12 percent
of total marketings in
2011, and from 15 percent only 10 years ago.
"The largest 50,000plus head capacity feedyards marketed 33 percent of all fed cattle in
2012. This is up from 25
percent 10 years ago. The
second largest category of
feedyards - feedyards of
32,000-49,999 head marketed 15 percent of
fed cattle last year," he
said.
USDA's report indicated that the total capacity
of the 1,000-plus head
feedyards was 16.9 million head on January 1,
2013, a decline of 100,000
head since January 1,
2012.
"Despite that decrease,
capacity utilization has
worsened for feedyards
due to larger declines in
the number of cattle
available for feeding,"
Mark said.
As of January 1, 2013,
about 66 percent of total
capacity in the 1,000-plus
head feedyards was being
utilized, compared to 70
percent a year ago.
"The data from this
report indicates that the
structural changes in the
feedlot industry that
were evident over the last
several years continued,
and even accelerated, in
2012," Mark said.
Mark adds that with
high feed costs likely to
continue much of 2013 at least until the 2013
corn harvest - it appears
like the number of feedyards will continue to
decline - especially for
the smaller sized operations, but loss of a few
large feedyards this next
year will likely occur too.
If
YOU READ THIS YOU KNOW…
ADVERTISING PAYS!
CALL THE
MISSOURI VALLEY SHOPPER
AT 665-5884
665-7811
OR STOP BY TO PLACE YOUR AD TODAY!
Shopper
SHOPPER
MISSOURI VALLEY
Missouri Valley
Almost NEW Mechanical Front Wheel Drive
John Deere Tractors
Noly Poppe 402-640-1306
info@perfecthay.com • www.perfecthay.com
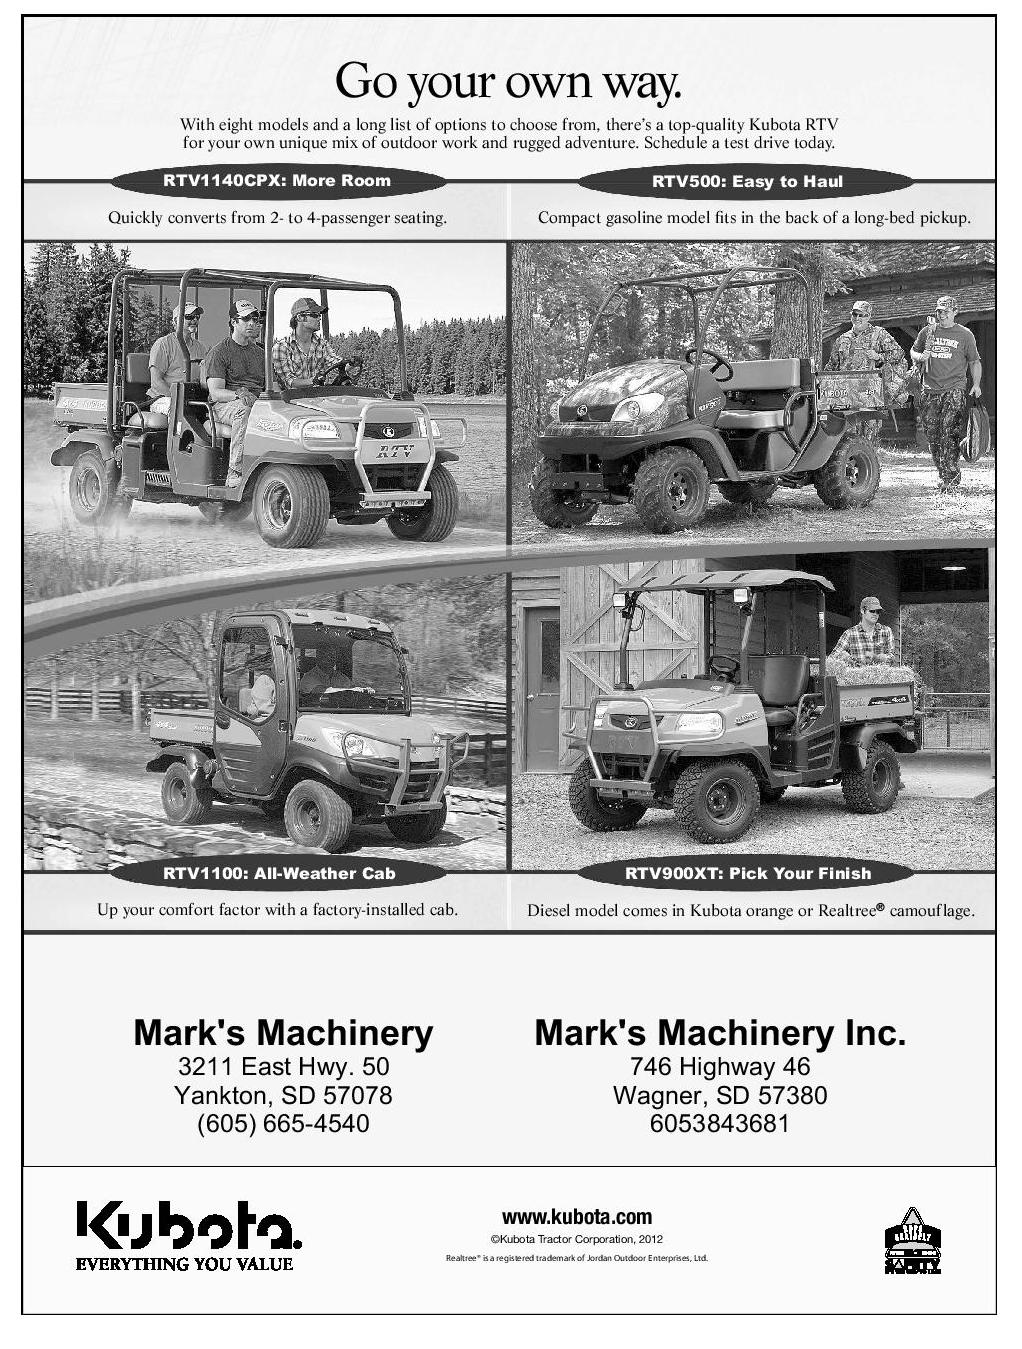
Go your own way.
RON’S AUTO GLASS INC.
We Fix Tractor Cab Glass
With eight models and a long list of options to choose from, there’s a top-quality Kubota RTV
for your own unique mix of outdoor work and rugged adventure. Schedule a test drive today.
" #
$
Quickly converts from 2- to 4-passenger seating.
Compact gasoline model ?ts in the back of a long-bed pickup.
Windshield Repair & Replacement
We Install Home, Auto & Business Glass
Locally Owned & Operated • Free Estimates
1915 Broadway • Yankton, SD (Next to Dairy Queen) • 605-665-9841
EHRESMANN
ENGINEERING
For All Your
Steel Needs!
STEEL SPECIALS
• Flat Bars • Solid Bars • Angle Iron •Channel Iron
• Round, Square & Retangle Tubing
• Many More types of steel to choose from
We Want to be Your Steel Supplier
Call us at 605-665-7532
4400 W. 31st St., Yankton, SD 57078
Up your comfort factor with a factory-installed cab.
!
Diesel model comes in Kubota orange or Realtree® camouflage.
!
www.kubota.com
©Kubota Tractor Corporation, 2012
Realtree® is a registered trademark of Jordan Outdoor Enterprises, Ltd.